-


Follow Us

If it wasn’t going to be a 60-minute effort, at least the bursts came at the right moments.
Life moves fast #Canucks pic.twitter.com/9BwIXv56nB
— Dan Machholz (@DanMachholz) January 28, 2024
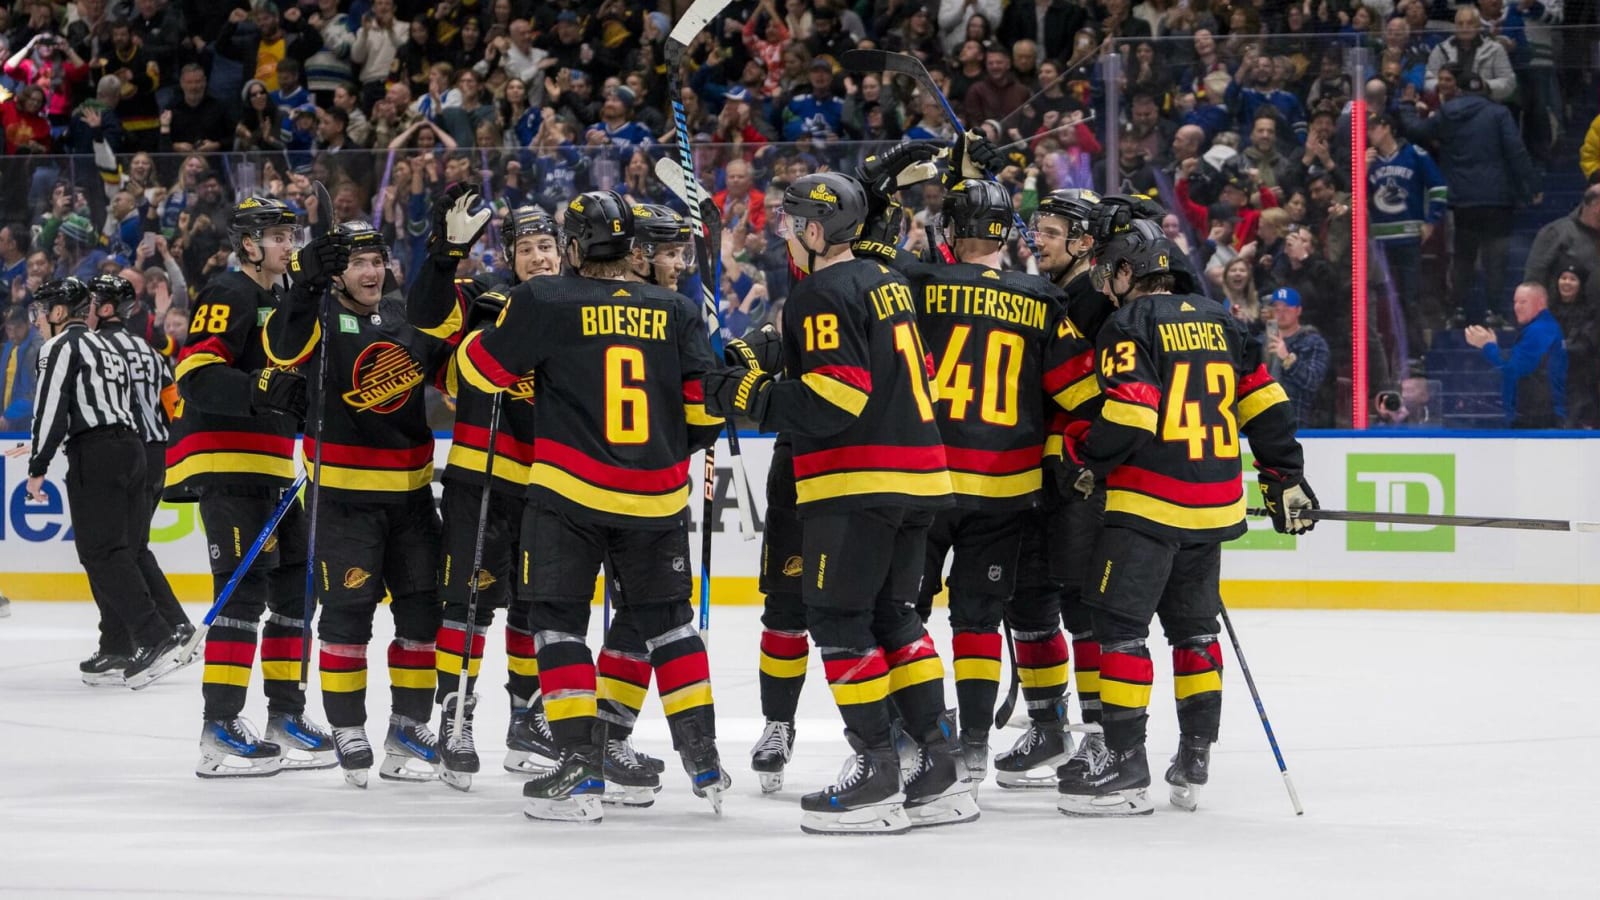
The Vancouver Canucks top the Columbus Blue Jackets by a 5-4 overtime scoreline. Vancouver once again came out of the gates hot, pushing the pace and taking it to their opponents, before sitting back in the middle frame. This time, Columbus made them pay, capitalizing on the opportunities they were provided to take a three-goal lead into the fourth. But, thanks to three power play tallies and a ferocious 5-minute PK, the Canucks erased the lead, taking it to the extra frame and delivering the dagger. An exciting fashion to win, suffice it to say.
Here’s the win, by the numbers.
As always, you can find our glossary guide of advanced stats here.
Game Flow

Comparing the numbers between the first and second periods gives an idea of how the Canucks’ play dropped off. Vancouver came out of the gates posting a 70.27 CF% and 82.98 xGF% share in the first period, which probably should’ve seen them put up a goal but was a good indication of the momentum they were carrying with their play. However, in the second, those numbers dropped to 45.65 CF% and 50.21 xGF%. Those aren’t awful numbers but are definitely significantly lower than the previous period, and proved to be what the Blue Jackets needed to take a 4-1 lead. Columbus did get a little “lucky” – they only put up 2.01 xGF for the game, with 1.28 coming in that middle frame. The Canucks were able to turn it back on for the third though, using a 79.83 xGF% to push this game into overtime.
Heat Map

Columbus isn’t exactly the most offensively threatening team, so a heat map like this makes sense. Despite the four goals given up, it wasn’t as if the Canucks were particularly letting them get repeatable chances to recreate those tallies. No hot spot was established off 24 scoring chances and 7 high-danger chances. Meanwhile, the Canucks got a boatload of opportunities, a total of 43 scoring chances and 17 high-danger ones. That patch right in the crease is plenty of evidence of the concentration of opportunities that they got, and it makes sense that 4 of the 5 goals were recorded off high-danger chances. Vancouver put themselves into a good position when it came to the repeatability of their scoring chances, which helped contribute to the comeback win.
Individual Advanced Stats
Corsi Champ: No other forward saw more ice time at 5v5 than Conor Garland and no other Canuck had a higher CF%. His 79.17 CF% was 31.55 CF% rel to the team average, the winger being a steady force throughout the game that kept carrying the boats even when other units were struggling. Yes, Garland didn’t find himself on the score sheet, but he and his line did an admirable job in matchup duties against Cole Sillinger, Yegor Chinakov, and Johnny Gaudreau, posting some very impressive defensive numbers against some good offensive talent. Garland was able to buy time for the Canucks to get their engine sparked for the comeback.
The way Garland protects the puck has an undersized guy really plays well for drawing penalties. #Canucks
— Grady Sas (@GradySas) January 28, 2024
Corsi Chump: Nils Höglander found himself at the very bottom of the team’s Corsi charts, tallying 15.79 CF% last night as the team’s worst. On ice for one goal for, the Swede also recorded a team-low 15.70 xGF%, yielding a 1-7 scoring chance lead to Columbus while not managing a single high-danger chance for. Höglander has been good during this home stand, which makes this game all the stranger for him. Hopefully, it’s just an anomalous performance in what has otherwise been a great stretch for the winger.
xGF: Garland finds himself leading this category too, putting together a team-high 94.35 xGF%. This wasn’t just because of a team-best 0.09 xGA though (which is also impressive given he played the most forward minutes at 5v5), but also his second-best 1.52 xGF, just behind Quinn Hughes’ 1.53. Garland was on ice for an 11-1 scoring chance lead for the Canucks, with a 6-0 differential in high-danger chances. His deployment was also pretty even too, with 50.00% of his zone starts coming in the offensive zone. Again, Garland didn’t show up on the scoresheet, but his impact on the game should not be understated.
GSAx: This won’t be the kindest to Thatcher Demko, who wasn’t exactly the busiest goalie last night. Since the Blue Jackets only managed to generate 2.01 xGF, Demko’s GSAx sits at a -1.99 on the game, which isn’t great by any stretch of the imagination. The goals were split evenly between high-danger chances and middle-danger chances, so not the worst distribution. It wasn’t as if Demko gave up particularly weak goals, but was a lot more human than he has looked this season. Still, he out-dueled Elvis Merzlikins, and that was all it took for the Canucks to secure victory.
Statistical Musings
The numbers behind Boeser’s hatty: Brock Boeser went a little cold recently, but broke out of the mini-slump in a huge way to reach the 30-goal plateau for the first time in his NHL career. He was rolling stats-wise too, producing the third-highest xGF (2.24), second-highest xGF% (85.23), and second-highest CF% (74.47) across all situations. While Boeser was on the ice, Vancouver out-chanced Columbus 24-6, with a 10-2 split in high-danger chances. Once again, Boeser, along with JT Miller and Elias Pettersson, found their magic on the power play, helping spur to life a spluttering first unit – and in the end, it took all of them getting back to their usual selves to get the Canucks to the win.
For the first time in his career, Brock Boeser (@BBoeser16) is a 30-goal scorer!
Hat Trick Challenge presented by @AstraZenecaUS pic.twitter.com/TqfSTKUCbj
— NHL (@NHL) January 28, 2024
Two forward lines working: It’s much of the same as last time out, as Suter-Miller-Boeser and Joshua-Blueger-Garland continue to click and help drive the Canucks forward. Suter-Miller-Boeser was the second-best forward unit across every metric and directed a 13-2 shot difference when they were on the ice. Meanwhile, Joshua-Blueger-Garland were leading the way with a 77.78 CF% and 93.30 xGF%, impressively creating a 1.18 xGF when no other line even cracked 0.50 xGF. It shouldn’t be a surprise that they saw the most ice time of any forward unit at 5v5, and allowed Tocchet to play his top end talent on the power play when they needed offence.
Noah Juulsen flirting with top 4 numbers: It was a solid performance by Noah Juulsen. The numbers back up a responsible defensive outing, pegging him as the Canucks’ fourth-best defender right behind Nikita Zadorov. Juulsen recorded a 57.14 CF% and 66.91 xGF%, both of which were better than Tyler Myers and Ian Cole last night. Since a rocky start to the year, he’s settled nicely into being the Canucks’ 7th defenceman, putting up good numbers and keeping his nose clean in the deployments that he is given. That’s all you can really ask from a depth option, and that improvement was definitely needed last night given the chaos that the stripes caused.
Noah Juulsen hits Adam Fantilli into the Canucks bench!
: Sportsnet | NHL pic.twitter.com/rpvhFXUN4b
— CanucksArmy (@CanucksArmy) January 28, 2024
As a team
CF% – 56.00% HDCF% – 70.83% xGF% – 68.31%
The Canucks will have to figure out how to play a full 60 minutes sooner rather than later. Their top offensive options also can’t be making that many mistakes and still expect to win hockey games. But, with how checked out this team looked in the second, with them being down three goals, to see them suddenly turn on another gear to pull the game back was impressive. The depth didn’t score any goals, but help buy enough time and carried the energy onwards until the Canucks’ best players could step up to the plate. And when they did, it helped guide them to the overtime victory.
Vancouver heads into the all-star break as the league’s best team. They don’t play again until February 6th, when they head into Carolina to face off against the Hurricanes.
Stats provided by naturalstattrick.com
More must-reads:
- Watch: Islanders avoid elimination with double-overtime win
- Watch: Brad Marchand breaks Bruins career playoff goals record
- The '100 catches in an NFL season' quiz
Breaking News
Customize Your Newsletter
 +
+
Get the latest news and rumors, customized to your favorite sports and teams. Emailed daily. Always free!